Tag Archives: International Broadband Rankings

The Need For Speed: How’s U.S. Broadband Doing?

My TechPolicyDaily colleague Roslyn Layton has begun a series comparing the European and U.S. broadband markets.

As a complement to her work, I thought I’d address a common misperception — the notion that American broadband networks are “pathetically slow.” Backers of heavier regulation of the communications market have used this line over the past several years, and for a time it achieved a sort of conventional wisdom. But is it true? I don’t think so.

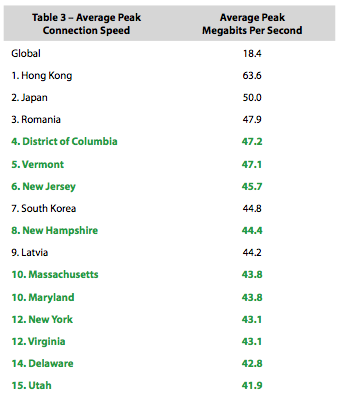
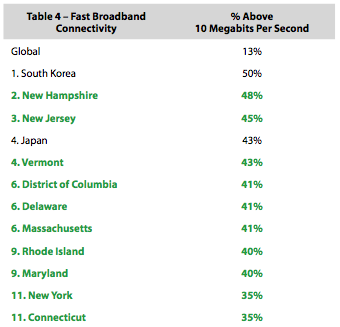
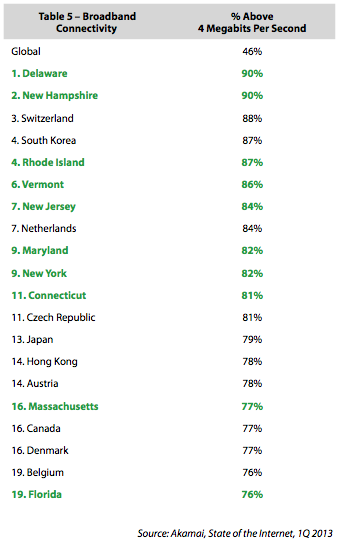
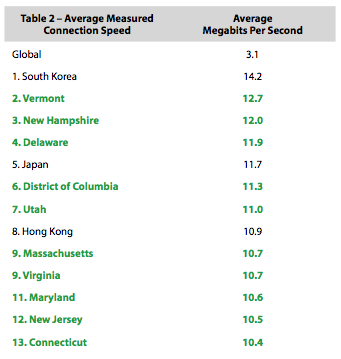
Real-time speed data collected by the Internet infrastructure firm Akamai shows U.S. broadband is the fastest of any large nation, and trails only a few tiny, densely populated countries. Akamai lists the top 10 nations in categories such as average connection speed; average peak speed; percent of connections with “fast” broadband; and percent of connections with broadband. The U.S., for example, ranks eighth among nations in average connection speed. And this is the number that is oft quoted. (This is a bit better than the no-longer-oft-used broadband penetration figures, which perennially showed the U.S. further down the list, at 15th or 26th place, for example.) Nearly all the the nations on these speed lists, however, with the exception of the U.S., are small, densely populated countries where it is far easier and more economical to build high-speed networks.

How to fix this? Well, Akamai also lists the top 10 American states in these categories. Because states are smaller, like the small nations that top the global list, they are a more appropriate basis for comparison. Last winter I combined the national and state figures and compiled a more appropriate comparative list. Using the newest data, I’ve updated the tables, which show that U.S. states (highlighted in green) dominate.

Average Connection SpeedAverage Peak Connection SpeedPercent Above 10 MbpsPercent Above 4 Mbps

Summarizing:

  • Ten of the top 13 entities for “average connection speed” are U.S. states.
  • Ten of the top 15 in “average peak connection speed” are U.S. states.
  • Ten of the top 12 in “percent of connections above 10 megabits per second” are U.S. states.
  • Ten of the top 20 in “percent of connections above 4 megabits per second” are U.S. states.

U.S. states thus account for 40 of the top 60 slots — or two-thirds — in these measures of actual global broadband speeds.

This is not a comprehensive analysis of the entire U.S. Less populated geographic areas, where it is more expensive to build networks, don’t enjoy speeds this high. But the same is true throughout the world.

World Broadband Update

The OECD published its annual Communications Outlook last week, and the 390 pages offer a wealth of information on all-things-Internet — fixed line, mobile, data traffic, price comparisons, etc. Among other remarkable findings, OECD notes that:

In 1960, only three countries — Canada, Sweden and the United States — had more than one phone for every four inhabitants. For most of what would become OECD countries a year later, the figure was less than 1 for every 10 inhabitants, and less than 1 in 100 in a couple of cases. At that time, the 84 million telephones in OECD countries represented 93% of the global total. Half a century later there are 1.7 billion telephones in OECD countries and a further 4.1 billion around the world. More than two in every three people on Earth now have a mobile phone.

Very useful stuff. But in recent times the report has also served as a chance for some to misrepresent the relative health of international broadband markets. The common refrain the past several years was that the U.S. had fallen way behind many European and Asian nations in broadband. The mantra that the U.S. is “15th in the world in broadband” — or 16th, 21st, 24th, take your pick — became a sort of common lament. Except it wasn’t true.

As we showed here, the second half of the two-thousand-aughts saw an American broadband boom. The Phoenix Center and others showed that the most cited stat in those previous OECD reports — broadband connections per 100 inhabitants — actually told you more about household size than broadband. And we developed metrics to better capture the overall health of a nation’s Internet market — IP traffic per Internet user and per capita.

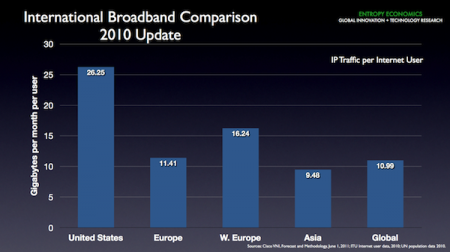
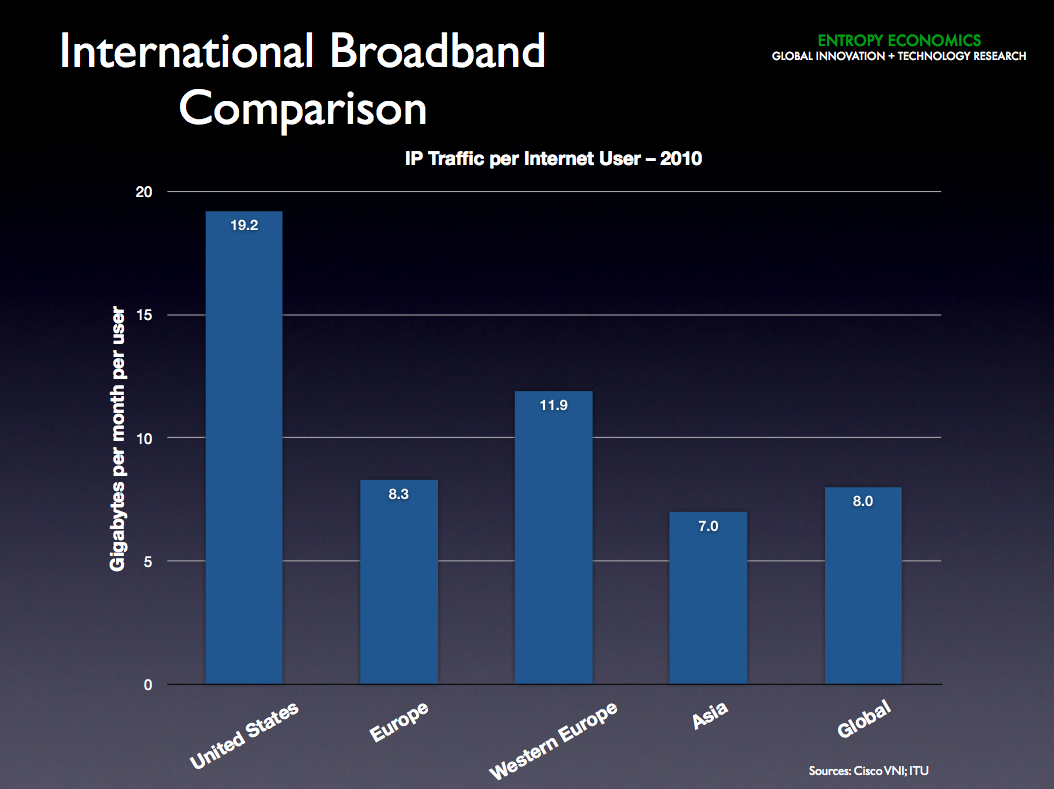
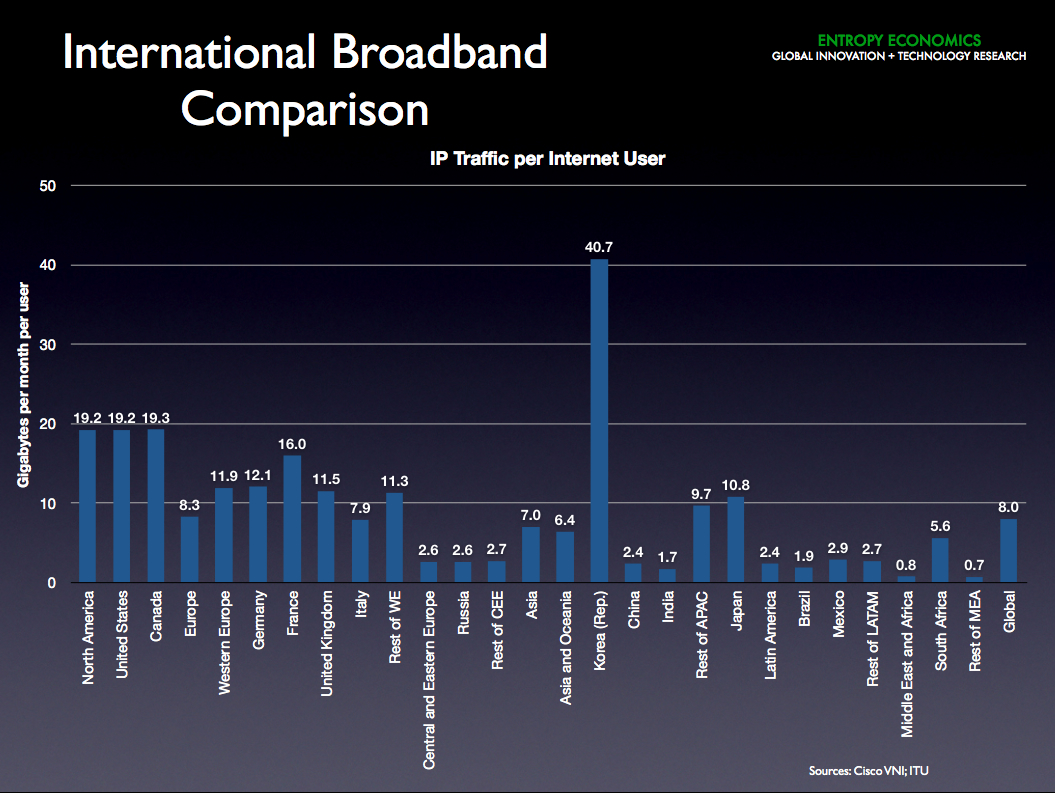
Below you’ll see an update of the IP traffic per Internet user chart, built upon Cisco’s most recent (June 1, 2011) Visual Networking Index report. The numbers, as they did last year, show the U.S. leads every region of the world in the amount of IP traffic we generate and consume both in per user and per capita terms. Among nations, only South Korea tops the U.S., and only Canada matches the U.S.

Although Asia contains broadband stalwarts like Korea, Japan, and Singapore, it also has many laggards. If we compare the U.S. to the most uniformly advanced region, Western Europe, we find the U.S. generates 62% more traffic per user. (These figures are based on Cisco’s 2010 traffic estimates and the ITU’s 2010 Internet user numbers.)

As we noted last year, it’s not possible for the U.S. to both lead the world by a large margin in Internet usage and lag so far behind in broadband. We think these traffic per user and per capita figures show that our residential, mobile, and business broadband networks are among the world’s most advanced and ubiquitous.

Lots of other quantitative and qualitative evidence — from our smart-phone adoption rates to the breakthrough products and services of world-leading device (Apple), software (Google, Apple), and content companies (Netflix) — reaffirms the fairly obvious fact that the U.S. Internet ecosystem is in fact healthy, vibrant, and growing. Far from lagging, it leads the world in most of the important digital innovation indicators.

— Bret Swanson

International Broadband Comparison, continued

New numbers from Cisco allow us to update our previous comparison of actual Internet usage around the world. We think this is a far more useful metric than the usual “broadband connections per 100 inhabitants” used by the OECD and others to compile the oft-cited world broadband rankings.

What the per capita metric really measures is household size. And because the U.S. has more people in each household than many other nations, we appear worse in those rankings. But as the Phoenix Center has noted, if each OECD nation reached 100% broadband nirvana — i.e., every household in every nation connected — the U.S. would actually fall from 15th to 20th. Residential connections per capita is thus not a very illuminating measure.

But look at the actual Internet traffic generated and consumed in the U.S.

The U.S. far outpaces every other region of the world. In the second chart, you can see that in fact only one nation, South Korea, generates significantly more Internet traffic per user than the U.S. This is no surprise. South Korea was the first nation to widely deploy fiber-to-the-x and was also the first to deploy 3G mobile, leading to not only robust infrastructure but also a vibrant Internet culture. The U.S. dwarfs most others.

If the U.S. was so far behind in broadband, we could not generate around twice as much network traffic per user compared to nations we are told far exceed our broadband capacity and connectivity. The U.S. has far to go in a never-ending buildout of its communications infrastructure. But we invest more than other nations, we’ve got better broadband infrastructure overall, and we use broadband more — and more effectively (see the Connectivity Scorecard and The Economist’s Digital Economy rankings) — than almost any other nation.

The conventional wisdom on this one is just plain wrong.