Author Archives: Admin

Digital Dynamism

See our new 20-page report — Digital Dynamism: Competition in the Internet Ecosystem:

The Internet is altering the communications landscape even faster than most imagined.

Data, apps, and content are delivered by a growing and diverse set of firms and platforms, interconnected in ever more complex ways. The new network, content, and service providers increasingly build their varied businesses on a common foundation — the universal Internet Protocol (IP). We thus witness an interesting phenomenon — the divergence of providers, platforms, services, content, and apps, and the convergence on IP.

The dynamism of the Internet ecosystem is its chief virtue. Infrastructure, services, and content are produced by an ever wider array of firms and platforms in overlapping and constantly shifting markets.

The simple, integrated telephone network, segregated entertainment networks, and early tiered Internet still exist, but have now been eclipsed by a far larger, more powerful phenomenon. A new, horizontal, hypercon- nected ecosystem has emerged. It is characterized by large investments, rapid innovation, and extreme product differentiation.

  • Consumers now enjoy at least five distinct, competing modes of broadband connectivity — cable modem, DSL, fiber optic, wireless broadband, and satellite — from at least five types of firms. Widespread wireless Wi- Fi nodes then extend these broadband connections.
  • Firms like Google, Microsoft, Amazon, Apple, Facebook, and Netflix are now major Internet infrastructure providers in the form of massive data centers, fiber networks, content delivery systems, cloud computing clusters, ecommerce and entertainment hubs, network protocols and software, and, in Google’s case, fiber optic access net- works. Some also build network devices and operating systems. Each competes to be the hub — or at least a hub — of the consumer’s digital life. So large are these new players that up to 80 percent of network traffic now bypasses the traditional public Internet backbone.
  • Billions of diverse consumer and enterprise devices plug into these networks, from PCs and laptops to smartphones and tablets, from game consoles and flat panel displays to automobiles, web cams, medical devices, and untold sensors and industrial machines.

The communications playing field is continually shifting. Cable disrupted telecom through broadband cable modem services. Mobile is a massively successful business, yet it is cannibalizing wireline services, with further disruptions from Skype and other IP communications apps. Mobile service providers used to control the handset market, but today handsets are mobile computers that wield their own substantial power with consumers. While the old networks typically delivered a single service — voice, video, or data — today’s broadband networks deliver multiple services, with the “Cloud” offering endless possibilities.

Also view the accompanying graphic, showing the progression of network innovation over time: Hyperconnected: The New Network Map.

U.S. Share of Internet Traffic Grows

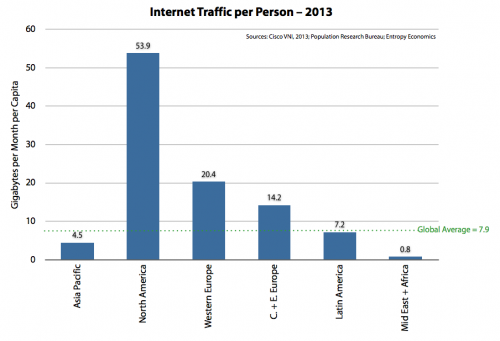
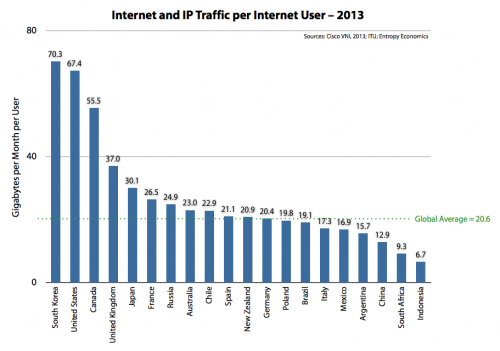
Over the last half decade, during a protracted economic slump, we’ve documented the persistent successes of Digital America — for example the rise of the App Economy. Measuring the health of our tech sectors is important, in part because policy agendas are often based on assertions of market failure (or regulatory failure) and often include comparisons with other nations. Several years ago we developed a simple new metric that we thought better reflected the health of broadband in international comparisons. Instead of measuring broadband using “penetration rates,” or the number of  connections per capita, we thought a much better indicator was actual Internet usage. So we started looking at Internet traffic per capita and per Internet user (see here, here, here, and, for more context, here).

We’ve update the numbers here, using Cisco’s Visual Networking Index for traffic estimates and Internet user figures from the International Telecommunications Union. And the numbers suggest the U.S. digital economy, and its broadband networks, are healthy and extending their lead internationally. (Patrick Brogan of USTelecom has also done excellent work on this front; see his new update.)

If we look at regional comparisons of traffic per person, we see North America generates and consumes nearly seven times the world average and more around two and a half times that of Western Europe.

Looking at individual nations, and switching to the metric of traffic per user, we find that the U.S. is actually pulling away from the rest of the world. In our previous reports, the U.S. trailed only South Korea, was essentially tied with Canada, and generated around 60-70% more traffic than Western European nations. Now, the U.S. has separated itself from Canada and is generating two to three times the traffic per user of Western Europe and Japan.

Perhaps the most remarkable fact, as Brogan notes, is that the U.S. has nearly caught up with South Korea, which, for the last decade, was a real outlier — far and away the worldwide leader in Internet infrastructure and usage.

Traffic is difficult to measure and its nature and composition can change quickly. There are a number of factors we’ll talk more about later, such as how much of this traffic originates in the U.S. but is destined for foreign lands. Yet these are some of the best numbers we have, and the general magnitudes reinforce the idea that the U.S. digital economy, under a relatively light-touch regulatory model, is performing well.

The Need For Speed: How’s U.S. Broadband Doing?

My TechPolicyDaily colleague Roslyn Layton has begun a series comparing the European and U.S. broadband markets.

As a complement to her work, I thought I’d address a common misperception — the notion that American broadband networks are “pathetically slow.” Backers of heavier regulation of the communications market have used this line over the past several years, and for a time it achieved a sort of conventional wisdom. But is it true? I don’t think so.

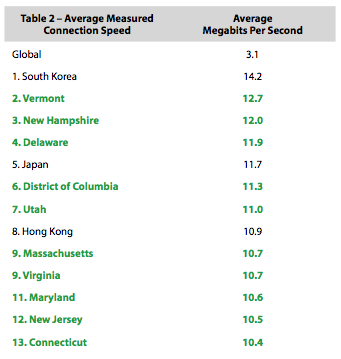
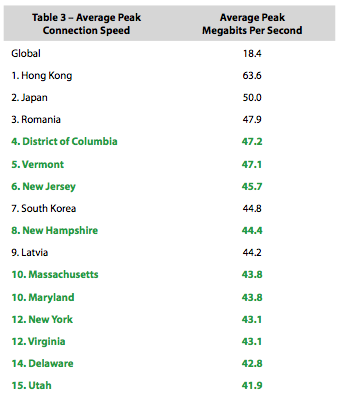
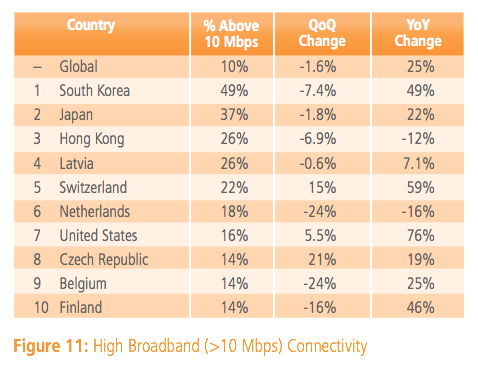
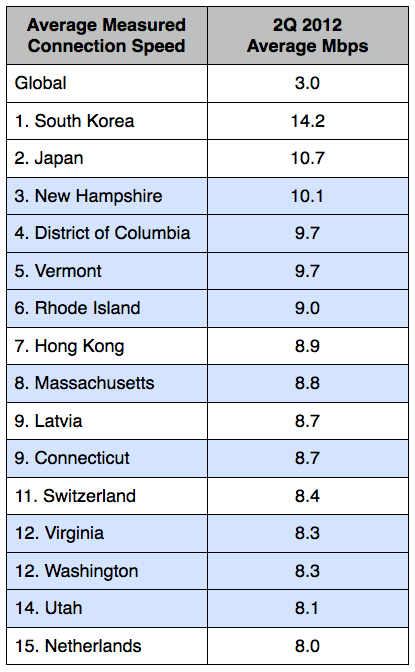
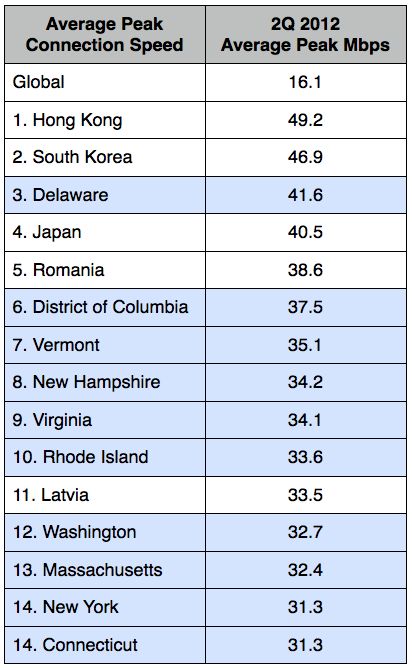
Real-time speed data collected by the Internet infrastructure firm Akamai shows U.S. broadband is the fastest of any large nation, and trails only a few tiny, densely populated countries. Akamai lists the top 10 nations in categories such as average connection speed; average peak speed; percent of connections with “fast” broadband; and percent of connections with broadband. The U.S., for example, ranks eighth among nations in average connection speed. And this is the number that is oft quoted. (This is a bit better than the no-longer-oft-used broadband penetration figures, which perennially showed the U.S. further down the list, at 15th or 26th place, for example.) Nearly all the the nations on these speed lists, however, with the exception of the U.S., are small, densely populated countries where it is far easier and more economical to build high-speed networks.

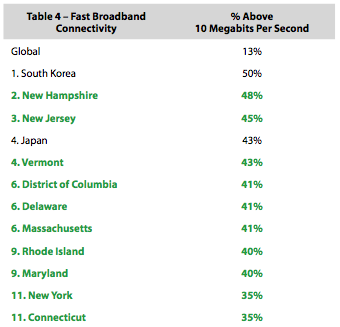
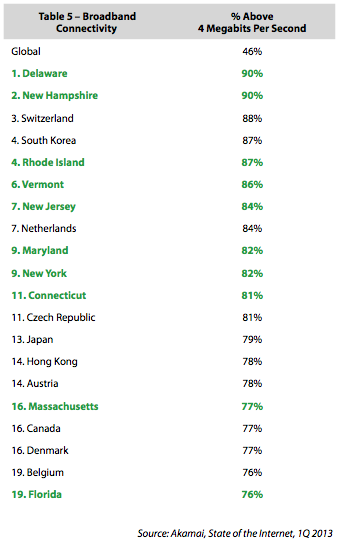
How to fix this? Well, Akamai also lists the top 10 American states in these categories. Because states are smaller, like the small nations that top the global list, they are a more appropriate basis for comparison. Last winter I combined the national and state figures and compiled a more appropriate comparative list. Using the newest data, I’ve updated the tables, which show that U.S. states (highlighted in green) dominate.

Average Connection SpeedAverage Peak Connection SpeedPercent Above 10 MbpsPercent Above 4 Mbps

Summarizing:

  • Ten of the top 13 entities for “average connection speed” are U.S. states.
  • Ten of the top 15 in “average peak connection speed” are U.S. states.
  • Ten of the top 12 in “percent of connections above 10 megabits per second” are U.S. states.
  • Ten of the top 20 in “percent of connections above 4 megabits per second” are U.S. states.

U.S. states thus account for 40 of the top 60 slots — or two-thirds — in these measures of actual global broadband speeds.

This is not a comprehensive analysis of the entire U.S. Less populated geographic areas, where it is more expensive to build networks, don’t enjoy speeds this high. But the same is true throughout the world.

Discussing Broadband and Economic Growth at AEI

On Tuesday this week, the American Enterprise Institute launched an exciting new project — the Center for Internet, Communications, and Technology. I was happy to participate in the inaugural event, which included talks by CEA chairman Jason Furman and Rep. Greg Walden (R-OR). We discussed broadband’s potential to boost economic productivity and focused on the importance and key questions of wireless spectrum policy. See the video below:

Risk and Resilience

The U.S. Chamber of Commerce Foundation’s summer edition of the Business Horizon Quarterly is a special issue on the topic of “Resilience.” Our contribution is an essay called “Long Live the Risk Takers.”

Wealth, however, can be a double-edged sword. With wealth comes resilience and thus an increased capacity to take risk. More risk can lead to further riches. Yet greater wealth also increases potential losses. In other words, we have a lot more to gain and a lot more to lose.

Perhaps it is not surprising then that many modern elites and policymakers see danger around every corner—from terrorism to climate change to financial calamity. In one sense, an obsession with risk is a luxury of wealth. It is prudent to identify present shortcomings and contemplate future problems and attempt to avoid them. Preventing hunger, unemployment, bomb plots, wars, and financial panics is a good thing.

What happens, though, when we develop a hyper-focus on shortcomings and potential losses? What happens when we seek a public policy remedy for every perceived problem? This kind of obsession with risk, danger, and downside may be counterproductive. It may exacerbate known problems and unleash dangers never dreamed of.  . . . read the entire article.

A Decade Later, Net Neutrality Goes To Court

Today the D.C. Federal Appeals Court hears Verizon’s challenge to the Federal Communications Commission’s “Open Internet Order” — better known as “net neutrality.”

Hard to believe, but we’ve been arguing over net neutrality for a decade. I just pulled up some testimony George Gilder and I prepared for a Senate Commerce Committee hearing in April 2004. In it, we asserted that a newish “horizontal layers” regulatory proposal, then circulating among comm-law policy wonks, would become the next big tech policy battlefield. Horizontal layers became net neutrality, the Bush FCC adopted the non-binding Four Principles of an open Internet in 2005, the Obama FCC pushed through actual regulations in 2010, and now today’s court challenge, which argues that the FCC has no authority to regulate the Internet and that, in fact, Congress told the FCC not to regulate the Internet.

Over the years we’ve followed the debate, and often weighed in. Here’s a sampling of our articles, reports, reply comments, and even some doggerel:

— Bret Swanson

Simple Rules For Spectrum

Washington is getting closer to unleashing more spectrum to fuel the digital economy and stay ahead of capacity constraints that will stymie innovation and raise prices for consumers. Ahead of the July 23 Congressional hearing on spectrum auctions, we should keep a couple things in mind. First and foremost, we need “Simple Rules for a Complex World.” It’s a basic idea that should apply to all policymaking. But especially in the exceedingly complex and fast-moving digital ecosystem.

A number of firms are seeking special rules that would complicate — and possibly undermine — the auctions. They want to exclude some rival firms from bidding in the auctions. They are suggesting exclusions, triggers, “one-third caps,” and other Rube Goldberg mechanisms they hope will tip the auction scales in their favor.

Using examples from the labor markets and capital markets, we showed in a recent paper that complex policies — even though well intended and designed by smart people — often yield perverse results. Laws and regulations should be few, simple, and neutral. Those advocating the special auction rules favor a process that is complex and biased.

They are also using complicated arguments to back their preferred complicated process. Some are asserting a “less is more” theory of auctions — the idea that fewer bidders can yield higher auction revenues. If it seems counterintuitive, it is. Their theory is based on a very specific, hypothetical auction where a dominant monopolist might scare off a potential new market entrant from bidding at all and walk away with the underpriced auction items. This hypothetical does not apply to America’s actual wireless spectrum market.

The U.S. has four national mobile service providers and a number of regional providers. We have lots of existing players, most of whom plan to bid in the auctions. As all the theory and evidence shows, in this situation, an open process with more bidders means a better auction — spectrum flowing to its highest value uses and more overall revenue.

Some studies show a policy excluding the top two bidders in the auction could reduce revenue by up to 40% — or $12 billion. This would not only prevent spectrum from flowing to its best use but could also jeopardize the whole purpose of the incentive auction, because lower prices could discourage TV broadcasters from “selling” their valuable airwaves. If the auction falls short, that means less spectrum, less mobile capacity, slower mobile broadband, and higher consumer prices. (See our recent Forbes article on the topic.)

Fortunately, several Members of Congress are adhering to the Simple Rules idea. They want to keep the spectrum auction open and competitive. They think this will  yield the most auction revenues and ensure the maximum amount of underutilized broadcast spectrum is repurposed for wireless broadband.

The argument for simple auction rules is simple. The argument for complex auction rules is very complicated.

Congress Asking Questions on IP Pools

A couple weeks ago I singled out one case (among many) that showed how important it is to improve our intellectual property institutions. Here’s that Forbes article.

I see Congress is now asking questions, too.

Congressional to Asst AG Baer 04.18.13 by Bret Swanson

Regulatory Complexity Gone Wild

The complexities of the Affordable Care Act (aka Obamacare) are multiple, metastasizing, and increasingly well-known. Less known is an additional layer of health care regulation slated for implementation next year: the system by which doctors and hospitals code for conditions, injuries, and treatments. By way of illustration, in the old system, a broken arm might get the code 156; pneumonia might be 397. The new system is much more advanced. As Ben Domenech notes:

In all, the new system, known as ICD-10, will boast 140,000 codes, a near-eight-fold rise over the mere 18,000 codes in ICD-9. It is a good example of the way bureaucracies grow in size and complexity in an attempt to match the complexity of society and the economy. This temptation, however, is usually perverse.

Complexity in the economy means new technologies, more specialized goods and services, and more consumer and vocational choice. Economic complexity, however, is built upon a foundation of simplicity – clear, basic rules and institutions. Simple rules encourage experimentation, promote long-term investments and entrepreneurial ventures, and allow the flexibility to drive and accommodate diversity.

Complex rules, on the other hand, often lead to just the opposite: less experimentation, investment, entrepreneurship, diversity, and choice.

It is difficult to quantify the effects of the metastasizing Administrative State. It is impossible to calculate, say, the cost of regulations that prohibit, discourage, or delay innovation. Likewise, what is the cost of the regulations that, arguably, helped cause the Financial Panic of 2008 and its policy fallout? No one can say with precision. For twenty years, though, the Competitive Enterprise Institute has catalogued regulatory complexity as well as anyone, and its latest report is astonishing.

Federal regulation, CEI’s latest “10,000 Commandments” survey finds, costs the U.S. economy some $1.8 trillion annually. That’s more than 10% of GDP, or nearly $15,000 per citizen. These estimates largely predate the implementation of the ACA, Dodd-Frank, and new rounds of EPA intervention. In other words, it’s only getting worse.

The legal scholar Richard Epstein argues that

The dismal performance of the IRS is but a symptom of a much larger disease which has taken root in the charters of many of the major administrative agencies in the United States today: the permit power. Private individuals are not allowed to engage in certain activities or to claim certain benefits without the approval of some major government agency. The standards for approval are nebulous at best, which makes it hard for any outside reviewer to overturn the agency’s decision on a particular application.

That power also gives the agency discretion to drag out its review, since few individuals or groups are foolhardy enough to jump the gun and set up shop without obtaining the necessary approvals first. It takes literally a few minutes for a skilled government administrator to demand information that costs millions of dollars to collect and that can tie up a project for years. That delay becomes even longer for projects that need approval from multiple agencies at the federal or state level, or both.

The beauty of all of this (for the government) is that there is no effective legal remedy. Any lawsuit that protests the improper government delay only delays the matter more. Worse still, it also invites that agency (and other agencies with which it has good relations) to slow down the clock on any other applications that the same party brings to the table. Faced with this unappetizing scenario, most sophisticated applicants prefer quiet diplomacy to frontal assault, especially if their solid connections or campaign contributions might expedite the application process. Every eager applicant may also be stymied by astute competitors intent on slowing the approval process down, in order to protect their own financial profits. So more quiet diplomacy leads to further social waste.

Epstein argues the FDA, EPA, FCC, and other agencies all use this permit power to control firms, industries, and people beyond any reasonable belief they are providing a net benefit to society.

The agencies are guilty of overreach and promoting their own metastasis. Yet without Congress and the President, they would have little or no power. Congresses and Presidents increasingly pass thousand-page laws that ask agencies to produce tens of thousands of pages of attendant rules and regulations. Complexity grows. Accountability is lost. The economy suffers. And the corrective paths, which fix mistakes and promote renewal in the rest of the economy and society, are blocked. We then pile on tomorrow’s complexity to “fix” the flaws created by yesterday’s complexity.

The hyper-regulation of the economy is not merely an annoyance, not merely about inefficient paperwork. It is damaging our innovative and productive capacity — and thus employment, the budget, and our standard of living.

The McKinsey Global Institute helps us understand why this matters from a macro perspective. McKinsey chose a dozen existing and emerging technologies and estimated their potential economic impact in the year 2025. It found industries like the mobile Internet, cloud computing, self-driving cars, and genomics could produce economic benefits of up to $33 trillion worldwide. The operative word, however, is “might.” Innovation is all about what’s new. And regulation is often about disallowing or discouraging what’s new. The growing complexity of the regulatory state, therefore, can only block some number of these innovations and is thus likely to leave us with a simpler, and thus poorer, world.

— Bret Swanson

Net ‘Neutrality’ or Net Dynamism? Easy Choice.

Consumers beware. A big content company wants to help pay for the sports you love to watch.

ESPN is reportedly talking with one or more mobile service providers about a new arrangement in which the sports giant might agree to pay the mobile providers so that its content doesn’t count against a subscriber’s data cap. People like watching sports on their mobile devices, but web video consumes lots of data and is especially tough on bandwidth-constrained mobile networks. The mobile providers and ESPN have noticed usage slowing as consumers approach their data subscription ceilings, after which they are commonly charged overage fees. ESPN doesn’t like this. It wants people to watch as much as possible. This is how it sells advertising. ESPN wants to help people watch more by, in effect, boosting the amount of data a user may consume — at no cost to the user.

As good a deal as this may be for consumers (and the companies involved), the potential arrangement offends some people’s very particular notion of “network neutrality.” They often have trouble defining what they mean by net neutrality, but they know rule breakers when they see them. Sure enough, long time net neutrality advocate Public Knowledge noted, “This is what a network neutrality violation looks like.”

The basic notion is that all bits on communications networks should be treated the same. No prioritization, no discrimination, and no partnerships between content companies and conduit companies. Over the last decade, however, as we debated net neutrality in great depth and breadth, we would point out that such a notional rule would likely result in many perverse consequences. For example, we noted that, had net neutrality existed at the time, the outlawing of pay-for-prioritization would have banned the rise of content delivery networks (CDNs), which have fundamentally improved the user experience for viewing online content. When challenged in this way, the net neutrality proponents would often reply, Well, we didn’t mean that. Of course that should be allowed. We also would point out that yesterday’s and today’s networks discriminate among bits in all sorts of ways, and that we would continue doing so in the future. Their arguments often deteriorated into a general view that Bad things should be banned. Good things should be allowed. And who do you think would be the arbiter of good and evil? You guessed it.

So what is the argument in the case of ESPN? The idea that ESPN would pay to exempt its bits from data caps apparently offends the abstract all-bits-equal notion. But why is this bad in concrete terms? No one is talking about blocking content. In fact, by paying for a portion of consumers’ data consumption, such an arrangement can boost consumption and consumer choice. Far from blocking content, consumers will enjoy more content. Now I can consume my 2 gigabytes of data plus all the ESPN streaming I want. That’s additive. And if I don’t watch ESPN, then I’m no worse off. But if the mobile company were banned from such an arrangement, it may be forced to raise prices for everyone. Now, because ESPN content is popular and bandwidth-hungry, I, especially as an ESPN non-watcher, am worse off.

So the critics’ real worry is, I suppose, that ESPN, by virtue of its size, could gain an advantage on some other sports content provider who chose not to offer a similar uncapped service. But this is NOT what government policy should be — the micromanagement of prices, products, the structure of markets, and relationships among competitive and cooperative firms. This is what we warned would happen. This is what we said net neutrality was really all about — protecting some firms and punishing others. Where is the consumer in this equation?

These practical and utilitarian arguments about technology and economics are important. Yet they ignore perhaps the biggest point of all: the FCC has no authority to regulate the Internet. The Internet is perhaps the greatest free-flowing, fast-growing, dynamic engine of cultural and economic value we’ve known. The Internet’s great virtue is its ability to change and grow, to foster experimentation and innovation. Diversity in networks, content, services, apps, and business models is a feature, not a bug. Regulation necessarily limits this freedom and diversity, making everything more homogeneous and diminishing the possibilities for entrepreneurship and innovation. Congress has given the FCC no authority to regulate the Internet. The FCC invented this job for itself and is now being challenged in court.

Possible ESPN-mobile partnerships are just the latest reminder of why we don’t want government limiting our choices — and all the possibilities — on the Internet.

— Bret Swanson

Debt Dynamics and the Growth Imperative

A critique of Carmen Reinhart and Ken Rogoff’s paper examining debt’s effect on growth dominated the economic news over the last week. Reinhart and Rogoff’s 2010 offering, Growth in a Time of Debt, compiled lots of data on debt-to-GDP ratios from nations around the globe and found that higher debt ratios, especially those at 90% or above, tended to be associated with slower growth. Three UMass-Amherst economists, however, noticed an error in R&R’s spreadsheet and argued that it (along with two other statistical choices) significantly altered the results. R&R acknowledged the spreadsheet error in a reply but defended the thrust of their work and its conclusions.

Champions of government spending jumped on the critique, charging that the R&R paper had given aid and comfort to widespread “austerity” policies and that their now-discredited ideas had sunk the world economy. They dubbed it “The Excel Depression.”

Others who have reviewed all the evidence, however, found R&R’s research holds up rather well. Harvard’s Greg Mankiw basically agrees and thinks

The coding error in Reinhart and Rogoff has gotten a lot more media attention than it deserves.

Then there is the entertaining contrarian Nassim Nicholas Taleb, who, in a tweet, goes further:

The coding error, I agree, is not remotely dispositive in this very big debate. So where does that leave us? We’ve still got these enormous debts, slow growth, and a still-yawning intellectual chasm on all the big public finance and monetary policy issues. As some have pointed out, a problem with this type of research is causation. Even if R&R are correct about the correlation, in other words, does high debt cause slow growth, or does slow growth cause high debt? These questions really get to the heart of economics and, like Taleb, I’m skeptical conventional macro is very enlightening.

We’ve been debating these very topics for centuries, or millennia. In The History of England, for example, Thomas Babington Macaulay reminded us of his nation’s apparently insurmountable debts following the interminable wars of the seventeenth and eighteenth centuries.*

When the great contest with Lewis the Fourteenth was finally terminated by the Peace of Utrecht the nation owed about fifty million; and that debt was considered not merely by the rude multitude, not merely by fox hunting squires and coffee-house orators, but by acute and profound thinkers, as an encumbrance which would permanently cripple the body politic . . . .

Soon war again broke forth; and under the energetic and prodigal administration of the first William Pitt, the debt rapidly swelled to a hundred and forty million. As soon as the first intoxication of victory was over, men of theory and men of business almost unanimously pronounced that the fatal day had now really arrived.

David Hume said the nation’s madness exceeded that of the Crusades. Among the intellectuals, only Edmund Burke demurred. “Adam Smith,” Macaulay continued,

saw a little, and but a little further. He admitted that, immense as the pressure was, the nation did actually sustain it and thrive. . . . But he warned his countrymen even a small increase [in debt] might be fatal.

Thus Britain’s attempt to tax its American colonies to pay down its debts. And thus another war — the Revolutionary — and thus another 100 million in new debts. More wars stemming from the French Revolution pushed Britain’s debts to 800 million, surely beyond any possibility of repayment.

Yet like Addison’s valetudinarian, who continued to whimper that he was dying of consumption till he became sofat that he was shamed into silence, [England] went on complaining that she was sunk in poverty till her wealth showed itself by tokens which made her complaints ridiculous . . . .

The beggared, the bankrupt society not only proved able to meet all its obligations, but while meeting these obligations, grew richer and richer so fast that the growth could almost be discerned by the eye . . . . While shallow politicians were repeating that the energies of the people were borne down by the weight of public burdens, the first journey was performed by steam on a railway. Soon the island was intersected by railways. A sum exceeding the whole amount of he national debt at the end of the American war was, in a few years, voluntarily expended by this ruined people on viaducts, tunnels, embankments, bridges, stations, engines. Meanwhile, taxation was almost constantly becoming lighter and lighter, yet still the Exchequer was full . . . .

Macaulay pinpointed the chief defect in the thinking of the alarmists.

They made no allowance for the effect produced by the incessant progress of every experimental science, and by the incessant effort of every man to get on in life. They saw that the debt grew and they forgot that other things grew as well as the debt.

Does this mean the spendthrifts are right? That we can — indeed, should — spend our way out of our predicaments, without much regard for the growing debt?

No.

A defect of the debt alarmists may be their curmudgeonly suspicion that budget imbalances always drive the economy downward. An even more egregious defect of the debt apologists, however, is their assumption that budget imbalances lift the economy upward and that spending is equal to growth, rather than a result of growth. The debt alarmists too often forget the possibilities of human achievement that are the basis for wealth. The debt apologists, however, assume wealth is inevitable, that it can be redistributed, and that their policies will have no harmful impact on wealth creation. The crucial point in Macaulay is not that any nation can sustain growing debts but that vibrantly growing economies (like that of the scientifically-advanced, exploratory, industrial British Empire) can sustain debts in larger amounts than is commonly assumed.

The debt alarmists, moreover, play into the hands of the spendthrifts. By making budget balance their sine qua non of policy, they equate spending restraint with tax increases. The spendthrifts say “fine, if budget balance is so important, let’s raise taxes.” Never mind the possible negative growth effects of higher tax rates (and regulations and the like). This is what has happened in much of Europe and now to some extent in the U.S. An obsession with debt too often impels policies that slow economic growth — real economic growth, based on productivity and innovation, not spending — thus greatly exacerbating the burden of debt. And make no mistake, the burdens of debt are real. Defaults, inflations, and bankruptcies happen. If interest rates rise several percentage points, the U.S. might be paying hundreds of billions more in interest. And this is why the shortened term structure of our debt is an even bigger concern. We should have been locking in very long terms at these historically low rates.

Like the British Empire, with its pound sterling, the U.S. has a great advantage in the dollar’s status as world reserve currency. We are probably able to sustain higher debts than would otherwise be the case because our debts are in our own currency and the safe haven status of Treasurys. Yet, how did the pound sterling or the dollar achieve reserve status? Through powerful economic growth of the currencies’ issuers.

In the current growth and policy environment, America’s debts are a substantial worry. Yet no policy should focus first on debt. We should ask whether each policy encourages or discourages entrepreneurship and real productivity enhancements. And whether each spending program is legitimate, effective, and efficient. If policy were driven, more often than not, by thoughtful answers to these questions, then the debt question would answer itself. Our debt ratio would likely decline, yet the amount of debt our economy could sustain would rise.

Here is David Malpass concisely making the point on CNBC:


— Bret Swanson

* Macaulay quotes from George Gilder’s book Wealth & Poverty.

U.S. Mobile: Effectively competitive? Probably. Positively healthy? Absolutely.

Each year the Federal Communications Commission is required to report on competition in the mobile phone market. Following Congress’s mandate to determine the level of industry competition, the FCC, for many years, labeled the industry “effectively competitive.” Then, starting a few years ago, the FCC declined to make such a determination. Yes, there had been some consolidation, it was acknowledged, yet the industry was healthier than ever — more subscribers, more devices, more services, lots of innovation. The failure to achieve the “effectively competitive” label was thus a point of contention.

This year’s “CMRS” — commercial mobile radio services — report again fails to make a designation, one way or the other. Yet whatever the report lacks in official labels, it more than makes up in impressive data.

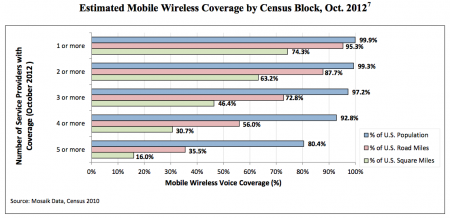
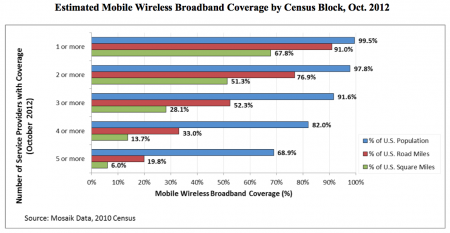
For example, it shows that as of October 2012, 97.2% of Americans have access to three or more mobile providers, and 92.8% have access to four or more. As for mobile broadband data services, 97.8% have access to two or more providers, and 91.6% have access to three or more.

Rural America is also doing well. The FCC finds 87% of rural consumers have access to three or more mobile voice providers, and 69.1% have access to four or more. For mobile broadband, 89.9% have access to two or more providers, while 65.4% enjoy access to three or more.

Call this what you will — to most laypeople, these choices count as robust competition. Yet the FCC has a point when it

refrain[s] from providing any single conclusion because such an assessment would be incomplete and possibly misleading in light of the variations and complexities we observe.

The industry has grown so large, with so many interconnected and dynamic players, it may have outgrown Congress’s request for a specific label.

14. Given the Report’s expansive view of mobile wireless services and its examination of competition across the entire mobile wireless ecosystem, we find that the mobile wireless ecosystem is sufficiently complex and multi-faceted that it would not be meaningful to try to make a single, all-inclusive finding regarding effective competition that adequately encompasses the level of competition in the various interrelated segments, types of services, and vast geographic areas of the mobile wireless industry.

Or as economist George Ford of the Phoenix Center put it,

The statute wants a competitive analysis, but as the Commission correctly points out, competition is not the goal, it [is] the means. Better performance is the goal. When the evidence presented in the Sixteenth Report is viewed in this way, the conclusion to be reached about the mobile industry, at least to me, is obvious: the U.S. mobile wireless industry is performing exceptionally well for consumers, regardless of whether or not it satisfies someone’s arbitrarily-defined standard of “effective competition.”

I’m in good company.  Outgoing FCC Chairman Julius Genachowski lists among his proudest achievements that “the U.S. is now the envy of the world in advanced wireless networks, devices, applications, among other areas.

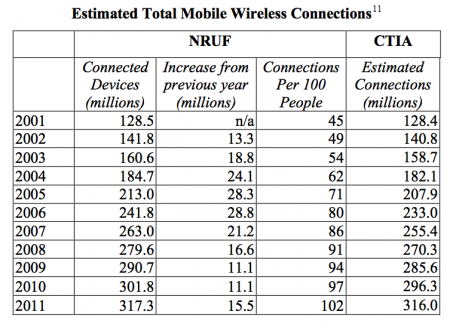
The report shows that in the last decade, U.S. mobile connections have nearly tripled. The U.S. now has more mobile connections than people.

The report also shows per user data consumption more than doubling year to year.

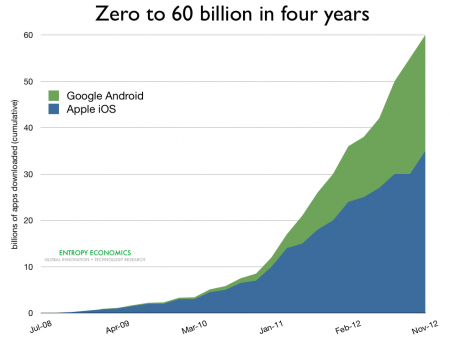
More important, the proliferation of smartphones, which are powerful mobile computers, is the foundation for a new American software industry widely known as the App Economy. We detailed the short but amazing history of the app and its impact on the economy in our report “Soft Power: Zero to 60 Billion in Four Years.” Likewise, these devices and software applications are changing industries that need changing. Last week, experts testified before Congress about mobile health, or mHealth, and we wrote about the coming health care productivity revolution in “The App-ification of Medicine.”

One factor that still threatens to limit mobile growth is the availability of spectrum. The report details past spectrum allocations that have borne fruit, but the pipeline of future spectrum allocations is uncertain. A more robust commitment to spectrum availability and a free-flowing spectrum market would ensure continued investment in networks, content, and services.

What Congress once called the mobile “phone” industry is now a sprawling global ecosystem and a central driver of economic advance. By most measures, the industry is effectively competitive. By any measure, it’s positively healthy.

— Bret Swanson

Quote of the Day

The statute wants a competitive analysis, but as the Commission correctly points out, competition is not the goal, it the means.  Better performance is the goal.  When the evidence presented in the Sixteenth Report is viewed in this way, the conclusion to be reached about the mobile industry, at least to me, is obvious:  the U.S. mobile wireless industry is performing exceptionally well for consumers, regardless of whether or not it satisfies someone’s arbitrarily-defined standard of “effective competition.”

— George Ford, Phoenix Center chief economist, commenting on the FCC’s 16th Wireless Competition report.

The Broadband Rooster

FCC chairman Julius Genachowski opens a new op-ed with a bang:

As Washington continues to wrangle over raising revenue and cutting spending, let’s not forget a crucial third element for reining in the deficit: economic growth. To sustain long-term economic health, America needs growth engines, areas of the economy that hold real promise of major expansion. Few sectors have more job-creating innovation potential than broadband, particularly mobile broadband.

Private-sector innovation in mobile broadband has been extraordinary. But maintaining the creative momentum in wireless networks, devices and apps will need an equally innovative wireless policy, or jobs and growth will be left on the table.

Economic growth is indeed the crucial missing link to employment, opportunity, and healthier government budgets. Technology is the key driver of long term growth, and even during the downturn the broadband economy has delivered. Michael Mandel estimates the “app economy,” for example, has created more than 500,000 jobs in less than five short years of existence.

We emphatically do need policies that will facilitate the next wave of digital innovation and growth. Chairman Genachowski’s top line assessment — that U.S. broadband is a success — is important. It rebuts the many false but persistent claims that U.S. broadband lags the world. Chairman Genachowski’s diagnosis of how we got here and his prescriptions for the future, however, are off the mark.

For example, he suggests U.S. mobile innovation is newer than it really is.

Over the past few years, after trailing Europe and Asia in mobile infrastructure and innovation, the U.S. has regained global leadership in mobile technology.

This American mobile resurgence did not take place in just the last “few years.” It began a little more than decade ago with smart decisions to:

(1) allow reasonable industry consolidation and relatively free spectrum allocation, after years of forced “competition,” which mandated network duplication and thus underinvestment in coverage and speed (we did in fact trail Europe in some important mobile metrics in the late 1990s and briefly into the 2000s);

(2) refrain from any but the most basic regulation of broadband in general and the mobile market in particular, encouraging experimental innovation; and

(3) finally implement the digital TV / 700 MHz transition in 2007, which put more of the best spectrum into the market.

These policies, among others, encouraged some $165 billion in mobile capital investment between 2001 and 2008 and launched a wave of mobile innovation. Development on the iPhone began in 2004, the iPhone itself arrived in 2007, and the app store in 2008. Google’s Android mobile OS came along in 2009, the year Mr. Genachowski arrived at the FCC. By this time, the American mobile juggernaut had already been in full flight for years, and the foundation was set — the U.S. topped the world in 3G mobile networks and device and software innovation. Wi-Fi, meanwhile surged from 2003 onward, creating an organic network of tens of millions of wireless nodes in homes, offices, and public spaces. Mr. Genachowski gets some points for not impeding the market as aggressively as some other more zealous regulators might have. But taking credit for America’s mobile miracle smacks of the rooster proudly puffing his chest at sunrise.

More important than who gets the credit, however, is determining what policies led to the current success . . . and which are likely to spur future growth. Chairman Genachowski is right to herald the incentive auctions that could unleash hundreds of megahertz of un- and under-used spectrum from the old TV broadcasters. Yet wrangling over the rules of the auctions could stretch on, delaying the the process. Worse, the rules themselves could restrict who can bid on or buy new spectrum, effectively allowing the FCC to favor certain firms, technologies, or friends at the expense of the best spectrum allocation. We’ve seen before that centrally planned spectrum allocations don’t work. The fact that the FCC is contemplating such an approach is worrisome. It runs counter to the policies that led to today’s mobile success.

The FCC also has a bad habit of changing the metrics and the rules in the middle of the game. For example, the FCC has been caught changing its “spectrum screen” to fit its needs. The screen attempts to show how much spectrum mobile operators hold in particular markets. During M&A reviews, however, the FCC has changed its screen procedures to make the data fit its opinion.

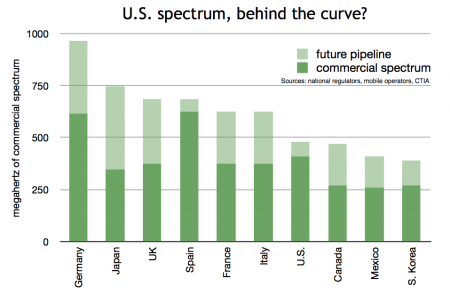
In a more recent example, Fred Campbell shows that the FCC alters its count of total available commercial spectrum to fit the argument it wants to make from day to day. We’ve shown that the U.S. trails other nations in the sum of currently available spectrum plus spectrum in the pipeline. Below, see a chart from last year showing how the U.S. compares favorably in existing commercially available spectrum but trails severely in pipeline spectrum. Translation: the U.S. did a pretty good job unleashing spectrum in 1990s through he mid-2000s. But, contrary to Chairman Genachowski’s implication, it has stalled in the last few years.

When the FCC wants to argue that particular companies shouldn’t be allowed to acquire more spectrum (whether through merger or secondary markets), it adopts this view that the U.S. trails in spectrum allocation. Yet when challenged on the more general point that the U.S. lags other nations, the FCC turns around and includes an extra 139 MHz in spectrum in the 2.5 GHz range to avoid the charge it’s fallen behind the curve.

Next, Chairman Genachowski heralds a new spectrum “sharing” policy where private companies would be allowed to access tiny portions of government-owned airwaves. This really is weak tea. The government, depending on how you measure, controls between 60% and 85% of the best spectrum for wireless broadband. It uses very little of it. Yet it refuses to part with meaningful portions, even though it would still be left with more than enough for its important uses — military and otherwise. If they can make it work (I’m skeptical), sharing may offer a marginal benefit. But it does not remotely fit the scale of the challenge.

Along the way, the FCC has been whittling away at mobile’s incentives for investment and its environment of experimentation. Chairman Genachowski, for example, imposed price controls on “data roaming,” even though it’s highly questionable he had the legal authority to do so. The Commission has also, with varied degrees of “success,” been attempting to impose its extralegal net neutrality framework to wireless. And of course the FCC has blocked, altered, and/or discouraged a number of important wireless mergers and secondary spectrum transactions.

Chairman Genachowski’s big picture is a pretty one: broadband innovation is key to economic growth. Look at the brush strokes, however, and there are reasons to believe sloppy and overanxious regulators are threatening to diminish America’s mobile masterpiece.

— Bret Swanson

Does Economic Growth Help the Middle Class?

That’s the question Jim Tankersley asked in a page one Washington Post story this week.

Here is how he summarized the situation:

“In the past three recoveries from recession, U.S. growth has not produced anywhere close to the job and income gains that previous generations of workers enjoyed. The wealthy have continued to do well. But a percentage point of increased growth today simply delivers fewer jobs across the economy and less money in the pockets of middle-class families than an identical point of growth produced in the 40 years after World War II.

That has been painfully apparent in the current recovery. Even as the Obama administration touts the return of economic growth, millions of Americans are not seeing an accompanying revival of better, higher-paying jobs.

The consequences of this breakdown are only now dawning on many economists and have not gained widespread attention among policymakers in Washington. Many lawmakers have yet to even acknowledge the problem. But repairing this link is arguably the most critical policy challenge for anyone who wants to lift the middle class.”

Tankersley cites the historical heuristic that a percentage point of GDP growth usually delivers about a half-point (0.5-0.6%) of employment growth.

“Three and a half years into the recovery that began in 2001 under President George W. Bush, job intensity was stuck at less than 0.2 percent. The recovery under President Obama is now up to an intensity of 0.3 percent, or about half the historical average.”

If we measure incomes, rather than employment, the situation appears even more dire:

“Middle-class income growth looks even worse for those recoveries. From 1992 to 1994, and again from 2002 to 2004, real median household incomes fell — even though the economy grew more than 6 percent, after adjustments for inflation, in both cases. From 2009 to 2011 the economy grew more than 4 percent, but real median incomes grew by 0.5 percent.”

What’s going on? Is the American middle class really in such bad shape? If so, why? And can we do anything about it? If not, why do these data appear to show a fundamental shift in the link between GDP growth and overall prosperity? These are big, complicated questions. For which I don’t have lots of concrete answers. I would, however, suggest a number of factors that may help us think about.

First, our economy does look different from the 1950s or 1960s. It is more complex. Back then, during a recession, factories laid off shifts of workers, leading to sharp employment downturns. Coming out of recessions, factories often hired back those same workers to build the same products. It was a simple process.

Today, although American manufacturing output is larger than ever, it employs a much smaller portion of the economy. The service and knowledge economies now dominate employment. And when jobs are not so closely tied to making widgets and the output is more ambiguous, the simple lay-off/hire-back formula disappears. In other words, we have lots more organizational and human capital today, and less “labor.”

This could be one reason the 1990 and 2001 recessions were shallower, but the job bounce-backs were slower.

Another factor, which everyone points out, is education. The United States may dominate many of the high-end professions in technology and finance because we have large cohorts of highly educated people (and immigrants). During the Great Recession and its aftermath, for example, the new App Economy, based on smartphones, broadband, and software, has created an estimated 500,000-600,000 jobs. Perhaps an also large cohort, however, not nearly as well educated or without the necessary knowledge skills, has been caught in a two-decade wave of globalization that quickly reduced the jobs this cohort was used to doing, without the possibility for quick changes to higher-value industries.

The Great Recession, however, was deeper and its employment rebound slower than the 1990 and 2001 recessions.

So we look to other factors that appear to be suppressing employment. In his new book The Redistribution Recession, University of Chicago economist Casey Mulligan argues that a host of well-intended safety-net programs are the chief culprit. Unemployment insurance, disability payments, the minimum wage, Medicaid, the earned income tax credit, food stamps and other programs can create deep disincentives to work and/or hire. Mulligan estimated that the average marginal tax rate on the relevant population increased eight percentage points, from 40% to 48%, during the Great Recession. For many individuals and families, the complex effects of these programs conspire to yield 100% marginal tax rates — that is, an extra dollar earned loses a dollar or more in benefits and taxes.

I would throw out another possible factor: monetary policy. The Fed’s unorthodox zero-interest-rate-plus-bond-buying policy has created free money for large firms and for government. We see government growing and corporate profits at record highs. But for small and medium-sized firms, credit is being rationed by regulators. Low rates are meaningless if credit is unavailable. The slow recovery for small firms, which are often acknowledged to create most jobs, could be part of the equation.

Switching from employment to income, a few factors are commonly mentioned:

  • Education and globalization may, as with employment, be boosting income for the top but limiting income prospects for the broad middle.
  • Health care and other benefits are rising as a portion of overall compensation, thus limiting the measured portion that we call wages or salaries.
  • Immigration has added millions of low-wage workers that may depress average measured incomes. These particular workers may be much better off than they were in their home countries and, by lowering wages for jobs few Americans want to do, may “harm” only a very small number of Americans.
  • Many income measures do not account for taxes and larger transfer payments in recent times through EITC, Medicaid, disability, unemployment, food stamps, etc. When these are factored in, the numbers look much different.

Alan Reynolds made the case for these underestimates in his 2006 book, Income and Wealth. And now Bruce D. Meyer of the University of Chicago and James X. Sullivan of Notre Dame find that median income growth has not suffered nearly as much as the conventional wisdom says.

“After appropriately accounting for inflation, taxes, and noncash benefits, we show that median income rose by more than 50 percent over the past three decades. This increase is considerably greater than the gains implied by official statistics—official median income rose by only 14 percent between 1980 and 2009. Our improved measure of income increased in each of the past three decades, although the growth has been much slower since 2000. Median consumption also rose at a similar rate over the whole period but at a faster rate than income over the past decade.”

The real income slowdown in the 2000s is not surprising. The decade included two recessions—including the big one. The decade also saw, for the first time since the 1970s, a good whiff of inflation, especially in food, fuel, and housing. Add in spiraling health care and education costs. So, despite spectacular gains in computers, communications, and consumer goods, the middle class squeeze often seems real.

Mark Perry and Don Boudreaux, however, are even more emphatic than Meyer and Sullivan. They say the “trope” of the stagnant middle class is “spectacularly wrong”:

“It is true enough that, when adjusted for inflation using the Consumer Price Index, the average hourly wage of nonsupervisory workers in America has remained about the same. But not just for three decades. The average hourly wage in real dollars has remained largely unchanged from at least 1964—when the Bureau of Labor Statistics (BLS) started reporting it.

“Moreover, there are several problems with this measurement of wages. First, the CPI overestimates inflation by underestimating the value of improvements in product quality and variety. Would you prefer 1980 medical care at 1980 prices, or 2013 care at 2013 prices? Most of us wouldn’t hesitate to choose the latter.

“Second, this wage figure ignores the rise over the past few decades in the portion of worker pay taken as (nontaxable) fringe benefits. This is no small matter—health benefits, pensions, paid leave and the rest now amount to an average of almost 31% of total compensation for all civilian workers according to the BLS.

“Third and most important, the average hourly wage is held down by the great increase of women and immigrants into the workforce over the past three decades. Precisely because the U.S. economy was flexible and strong, it created millions of jobs for the influx of many often lesser-skilled workers who sought employment during these years.”

Perry and Boudreaux go on to say that no income figures—whether the officially stagnant ones or the higher adjusted figures—can account for the dramatic rise in the quantity and quality of consumption that income yields.

Bill Gates in his private jet flies with more personal space than does Joe Six-Pack when making a similar trip on a commercial jetliner. But unlike his 1970s counterpart, Joe routinely travels the same great distances in roughly the same time as do the world’s wealthiest tycoons.

What’s true for long-distance travel is also true for food, cars, entertainment, electronics, communications and many other aspects of ‘consumability.’ Today, the quantities and qualities of what ordinary Americans consume are closer to that of rich Americans than they were in decades past. Consider the electronic products that every middle-class teenager can now afford—iPhones, iPads, iPods and laptop computers. They aren’t much inferior to the electronic gadgets now used by the top 1% of American income earners, and often they are exactly the same.”

Despite all the factors in this multifaceted debate, one thing is certain. Economic growth is better for the middle class than is economic stagnation.

Zero GDP Reading Exposes the Real Deficit – Economic Growth

It is currently in fashion to say, with great contrarian flair, that federal spending growth is the slowest since the Eisenhower Administration. Or, as someone famous recently put it, “We don’t have a spending problem.”

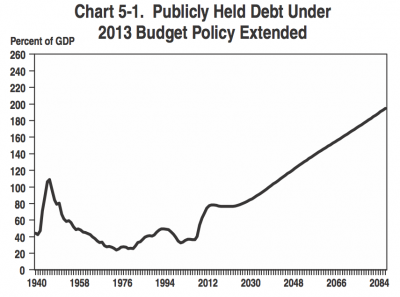
This assertion is, to put it mildly, debatable. Spending jumped 18% in just one year during the Panic of 2008-09. If the government keeps spending at that level, but starts counting after the jump, then the growth rate will appear modest. Spending as a share of GDP is higher than at anytime since World War II, and so is the debt-to-GDP ratio. As the OMB chart below shows, it gets much worse.

Nevertheless, does anyone disagree that we have a growth problem, and a serious one? Yesterday’s negative GDP estimate for the fourth quarter of 2012 (-0.1%) should jolt the nation.

Let’s stipulate the GDP reading’s anomalies — lower than expected inventories and defense spending, which could reverse and add a bit to future growth. Yet economists had expected fourth quarter growth of 1.1% — itself an abysmal projection — and actual growth for the entire year was a barely mediocre 2.2%. Consider, too, that lots of economic activity was moved forward into 2012 to beat the Fiscal Cliff taxman. And don’t forget the Federal Reserve’s extraordinary QE programs, which are supposed to boost growth.

Whatever we’re doing, it’s not working. Not nearly well enough to create jobs. And not nearly well enough to help the budget. Because whatever you think about spending or taxes, the key factor in the health of the budget is economic growth.

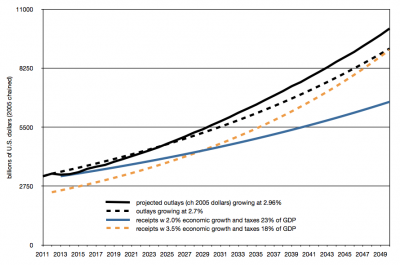
OMB projects spending will grow (from today’s historically high level) around 2.96% per year through 2050. It projects annual economic growth over the period of 2.5%. That gets us a debt crisis somewhere down the line, and lots of other economic and social problems along the way.

Last year, however, keep in mind, growth was just 2.2%, following 2011’s even worse reading of 1.8%. If we can’t even match the modest 2.5% long-term projection coming out of a severe downturn, our problems may be worse than we think. Economist Robert Gordon of Northwestern asks “Is U.S. Growth Over?” Outlining seven economic headwinds, he projects growth of around 1.5% over the next few decades. In the chart below, you can see what a budget disaster such a slowdown would produce. Deficits quickly grow from a trillion dollars a year today into the many trillions per year.

Perhaps, many are now suggesting, we can tax our way out of the problem. Almost all academic research, however, suggests higher taxes (in terms of rates and as a portion of the economy) hurt economic growth. The Tax Foundation, for example, surveyed the 26 major studies on the topic going back to the early 1980s. Twenty-three of the studies found that taxes hurt economic growth. No study found higher taxes helped growth. Recent experience in Europe tends to confirm these findings.

Today, most of the policy discussion revolves around debt ceilings, sequesters, and the (fading) possibility of grand bargain budget deal. Mostly lost in the equation is economic growth. One question should dominate the thinking of policymakers: What policies would encourage more productive economic activity?

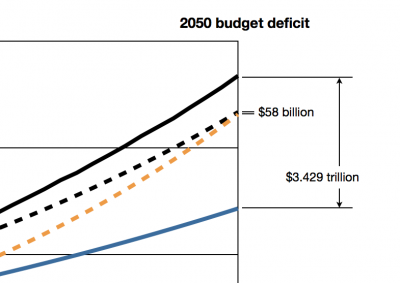
The new possibility of a breakthrough on immigration reform is an encouraging example. A more rational immigration policy for both low-skilled and high-skilled workers could boost economic growth significantly. Can we find more such policies? As you can see in the chart below, higher taxes can’t make up the budget shortfall. Faster growth and modest spending restraint can. This chart once again shows the OMB projected spending path (solid black line). The solid blue line shows what would happen to tax receipts if (1) growth remains mediocre and (2) we somehow find a way to dramatically raise the portion of the economy Washington taxes from the historical 18% to 23%.

That’s a major jump in taxation. Yet it doesn’t get us close to a healthy budget.

Faster growth and modest spending restraint, on the other hand, close the budget gap. And they do so without increasing the share Washington historically takes from the economy. The orange dashed line shows tax receipts under an economy growing at 3.5% with the historic 18% tax-to-GDP ratio. (Growth of 3.5% may sound like an ambitious goal. Keep in mind, however, that we are still far below trend — we’ve never really recovered from the Great Recession. Long term growth of 3.5%, therefore, merely includes a more rapid recovery to trend over the next several years and then a resumption of the long-term average of 3%.) In the medium to long term, a faster growth-lower tax regime generates more tax revenue than a slow growth-high tax regime.

Faster growth alone would be enough to stabilize budget deficits at today’s levels. But that is not enough. Trillion dollar deficits and Washington spending an ever rising share of the economy are not acceptable. Look, however, at the very modest spending restraint that would be required to essentially balance the budget by 2050. If we slowed spending growth from the projected 2.96% annual rate to just 2.7%, we could close the gap.

Does anyone think spending growth of 2.7% per year versus 2.96% is going to tear apart Social Security, Medicare, the military, or other essential government functions. Many of us could imagine responsible ways to reduce projected spending far, far more than that. All this shows is that a little restraint and robust economic growth go a long way.

The slow growth-high tax scenario produces a budget deficit of almost $3.5 trillion in 2050. Under the faster growth-lower tax scenario, with a touch of spending restraint, the 2050 budget deficit would be just $58 billion.

Now, I’m not pretending I know that a higher tax-to-GDP ratio will produce a particular rate of economic growth. The above are just rough scenarios. Lots of factors are in play. And that is precisely the point. Given an complex, uncertain world, we should attempt to align all our policies for economic growth. We know what policies tend to encourage growth, and those that tend to stunt it.

That means getting immigration policy right — and it appears we may finally be getting somewhere. It means smart, reasonable regulatory policies in energy, health care, education, communications, and intellectual property. It means a healthy division of powers between the federal and state governments. And, yes, it means sweeping tax reform — both individual and corporate.

What we are doing today isn’t working. We are on a dangerous path. Two percent growth won’t get us anywhere. No matter how much we tax ourselves. Only robust growth fueled by entrepreneurship and investment, with a healthy faith in the unknown possibilities of America’s future, will get us there.

Ignorance, the Ultimate Asset

Grab a cup of coffee and check out our new article at The American, the online magazine of the American Enterprise Institute.

“Ignorance, the Ultimate Asset”

Broadband Bullfeathers

Several years ago, some American lawyers and policymakers were looking for ways to boost government control of the Internet. So they launched a campaign to portray U.S. broadband as a pathetic patchwork of tin-cans-and-strings from the 1950s. The implication was that broadband could use a good bit of government “help.”

They initially had some success with a gullible press. The favorite tools were several reports that measured, nation by nation, the number of broadband connections per 100 inhabitants. The U.S. emerged from these reports looking very mediocre. How many times did we read, “The U.S. is 16th in the world in broadband”? Upon inspection, however, the reports weren’t very useful. Among other problems, they were better at measuring household size than broadband health. America, with its larger households, would naturally have fewer residential broadband subscriptions (not broadband users) than nations with smaller households (and thus more households per capita). And as the Phoenix Center demonstrated, rather hilariously, if the U.S. and other nations achieved 100% residential broadband penetration, America would actually fall to 20th from 15th.

In the fall of 2009, a voluminous report from Harvard’s Berkman Center tried to stitch the supposedly ominous global evidence into a case-closed indictment of U.S. broadband. The Berkman report, however, was a complete bust (see, for example, these thorough critiques: 1, 2, and 3 as well as my brief summary analysis).

Berkman’s statistical analyses had failed on their own terms. Yet it was still important to think about the broadband economy in a larger context. We asked the question, how could U.S. broadband be so backward if so much of the world’s innovation in broadband content, services, and devices was happening here?

To name just a few: cloud computing, YouTube, Twitter, Facebook, Netflix, iPhone, Android, ebooks, app stores, iPad. We also showed that the U.S. generates around 60% more network traffic per capita and per Internet user than Western Europe, the supposed world broadband leader. The examples multiply by the day. As FCC chairman Julius Genachowski likes to remind us, the U.S. now has more 4G LTE wireless subscribers than the rest of the world combined.

Yet here comes a new book with the same general thrust — that the structure of the U.S. communications market is delivering poor information services to American consumers. In several new commentaries summarizing the forthcoming book’s arguments, author Susan Crawford’s key assertion is that U.S. broadband is slow. It’s so bad, she thinks broadband should be a government utility. But is U.S. broadband slow?

According to actual network throughput measured by Akamai, the world’s largest content delivery network, the U.S. ranks in the top ten or 15 across a range of bandwidth metrics. It is ninth in average connection speed, for instance, and 13th in average peak speed. Looking at proportions of populations who enjoy speeds above a certain threshold, Akamai finds the U.S. is seventh in the percentage of connections exceeding 10 megabits per second (Mbps) and 13th in the percentage exceeding 4 Mbps. (See the State of the Internet report, 2Q 2012.)

You may not be impressed with rankings of seventh or 13th. But did you look at the top nations on the list? Hong Kong, South Korea, Latvia, Switzerland, the Netherlands, Japan, etc.

Each one of them is a relatively small, densely populated country. The national rankings are largely artifacts of geography and the size of the jurisdictions observed. Small nations with high population densities fare well. It is far more economical to build high-speed communications links in cities and other relatively dense populations. Accounting for this size factor, the U.S. actually looks amazingly good. Only Canada comes close to the U.S. among geographically larger nations.

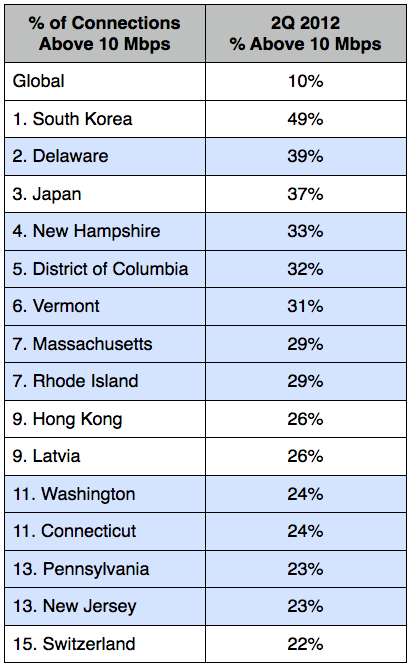
But let’s look even further into the data. Akamai also supplies speeds for individual U.S. states. If we merge the tables of nations and states, the U.S. begins to look not like a broadband backwater or even a middling performer but an overwhelming success. Here are the two sets of Akamai data combined into tables that directly compare the successful small nations with their more natural counterparts, the U.S. states (shaded in blue).

Average Broadband Connection Speed — Nine of the top 15 entities are U.S. states.

Average Peak Connection Speed — Ten of the top 15 entities are U.S. states.

Percent of Connections Over 10 Megabits per Second — Ten of the top 15 entities are U.S. states.

Percent of Connections Over 4 Megabits per Second — Ten of the top 16 entities are U.S. states.

Among the 61 ranked entities on these four measures of broadband speed, 39, or almost two-thirds, are U.S. states. American broadband is not “pitifully slow.” In fact, if we were to summarize U.S. broadband, we’d have to say, compared to the rest of the world, it is very fast.

It is true that not every state or region in the U.S. enjoys top speeds. Yes, we need more, better, faster, wider coverage of wired and wireless broadband. In underserved neighborhoods as well as our already advanced areas. We need constant improvement both to accommodate today’s content and services and to drive tomorrow’s innovations. We should not, however, be making broad policy under the illusion that U.S. broadband, taken as a whole, is deficient. The quickest way to make U.S. broadband deficient is probably to enact policies that discourage investment and innovation — such as trying to turn a pretty successful and healthy industry that invests $60 billion a year into a government utility.

— Bret Swanson

“Deck the Halls with Macro Follies” – featuring Jean-Baptiste Say!

The App Economy, so far

See our new report summarizing the short but amazing life of the mobile app: Soft Power: Zero to 60 Billion in Four Years.

« Previous PageNext Page »